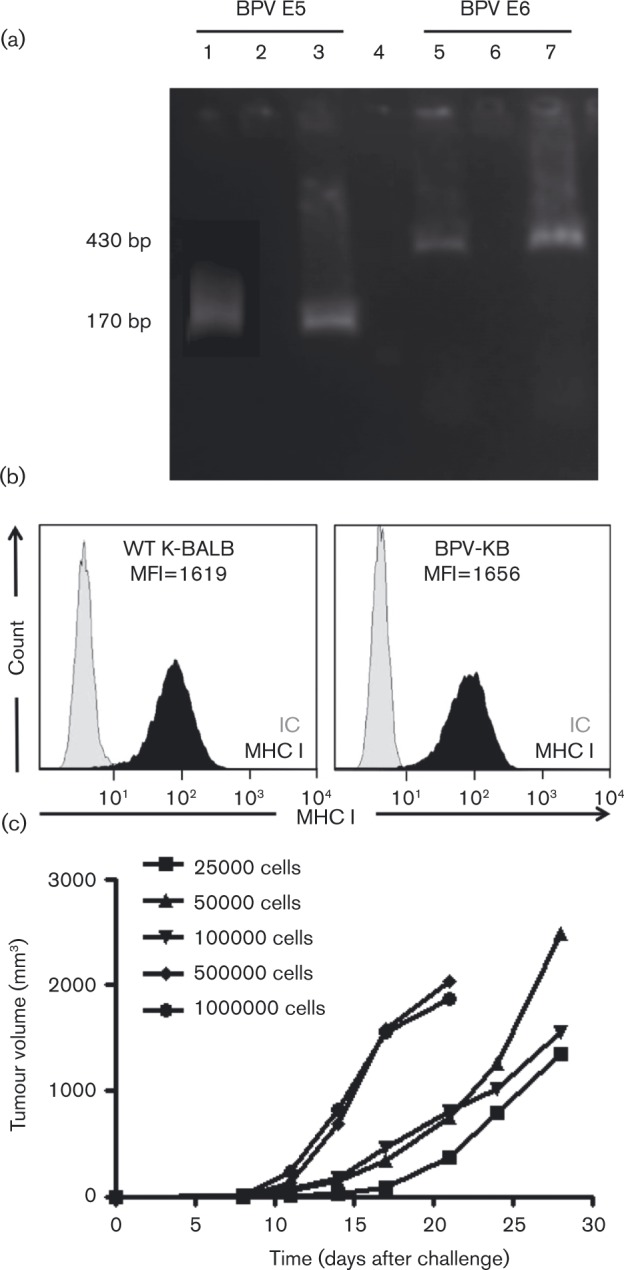
Fig. 1. Characteristics of the BPV-KB equine sarcoid-like tumour cell line. (a) BPV E5/E6 expression by RT-PCR on BPV-KB tumour cells using E5 primers (lanes 1–3) or E6 primers (lanes 5–7). Lanes 1 and 5, BPV-1 plasmid DNA; lanes 2 and 6, ‘no reverse transcriptase’ control; lanes 3 and 7, BPV-KB cDNA. Lane 4, 100bp DNA ladder. (b) MHC I expression on tumour cells. Black curves represent FITC-labelled anti-MHC I antibody and grey curves are isotype controls (IC). Shown is a representative example of an experiment performed in triplicate. MHC I expression in BPV-KB cells [mean fluorescence intensity (MFI)51656] is equivalent to that in WT K-BALB cells (MFI51619). (c) BPV-KB cells induce progressively growing tumours in 100 % of BALB/c mice (n = 55 per group). Mean tumour volume is plotted versus days after challenge.

