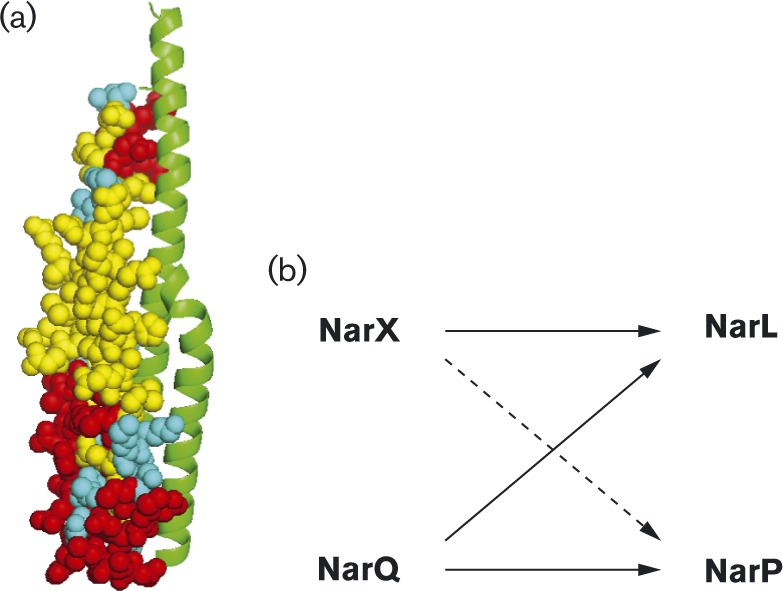
Fig. 1. (a) Model of the NarX DHp domain homodimer. One monomer is shown as a ribbon diagram, the other in spheres. Residues identical and similar between NarX and NarQ are shown in yellow and cyan, respectively. Dissimilar residues, shown in red, provide specificity determinants both for homodimer formation and for response regulator interaction. (b) Interactions in the NarX–NarL and NarQ–NarP cross regulation network. The dashed arrow represents relatively low phosphoryl-transfer rates between NarX and NarP. Adapted from Noriega et al. (2010).

