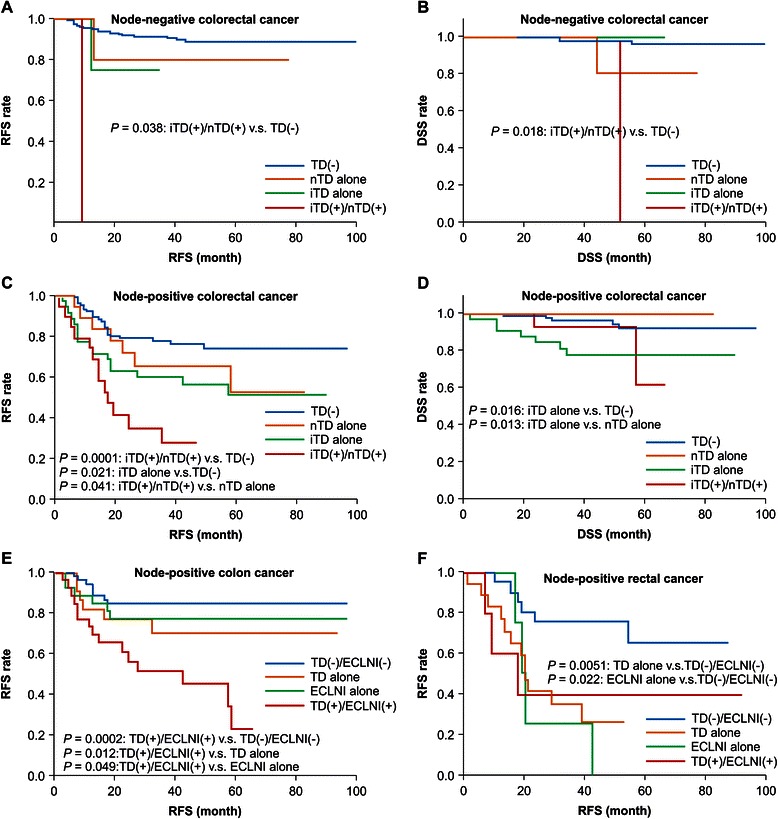
Fig. 2.

Kaplan–Meier survival curves for patients depending on TD status and ECLNI status. We analyzed associations between survival and the presence of invasive-type tumor deposits (iTDs), nodular-type tumor deposits (nTDs), and extracapsular lymph node involvement (ECLNI). These analyses were further stratified according to N status. a Among node-negative patients, relapse-free survival (RFS) differed significantly between the both iTD and nTD (iTD(+)/nTD(+)) and no TD (TD(−)) groups (P = 0.038). b Among node-negative patients, disease-specific survival (DSS) differed significantly between the iTD(+)/nTD(+) and TD(−) groups (P = 0.018). c Among node-positive patients, the RFS rates of the iTD(+)/nTD(+) group differed significantly from those of the TD(−) group and the nTD alone group (P = 0.0001 and 0.041, respectively). Among node-positive patients, RFS differed significantly between the iTD alone and TD(−) in groups (P = 0.021). d Among node-positive patients, the DSS rates of the iTD alone group differed significantly from those of the TD(−) group and the nTD alone group (P = 0.016 and 0.013, respectively). e Among node-positive patients with colon cancer, the RFS rates of the TD(+)/ECLNI(+) group differed significantly from those of the TD(−)/ECLNI(−), TD alone, and ECLNI alone groups (P = 0.002, 0.012, and 0.049, respectively). f Among node-positive patients with rectal cancer, the RFS rates of the TD(−)/ECLNI(−) group differed significantly from those of the TD alone group and the ECLNI alone group (P = 0.0051 and 0.022, respectively)
