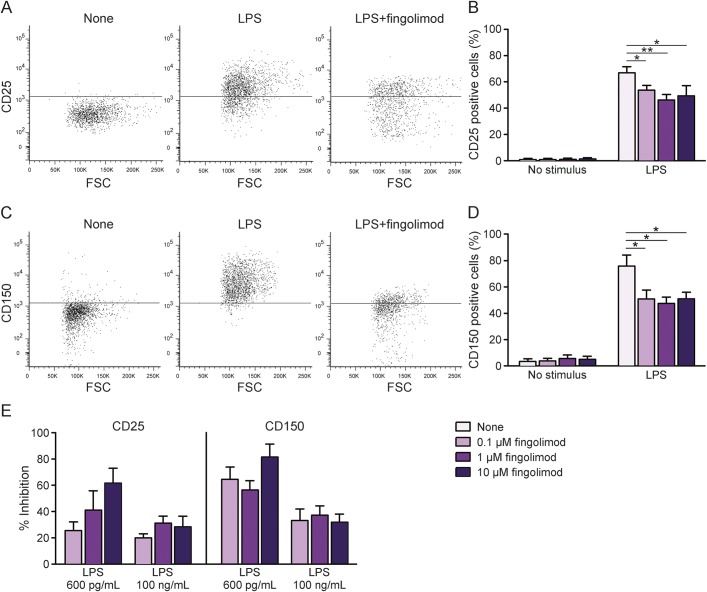
Figure 2. Fingolimod impairs induction of activation markers on human monocytes.
Peripheral blood mononuclear cells from healthy donors were briefly exposed to increasing concentrations of fingolimod (0.1 μM, 1 μM, and 10 μM) or vehicle, and left in culture for 18 hours, eventually in the presence of 100 ng/mL lipopolysaccharide (LPS). Monocyte activation was monitored by staining for 2 surface markers, CD25 (A, B) and CD150 (C, D). Gates on monocytes in forward vs side scatterplot and then on viable (7-AAD negative) cells were applied. Thresholds were set on relative isotype controls. (A, C) Representative CD25 and CD150 stainings in unstimulated (left panels), LPS-stimulated (middle panels), or LPS-stimulated cultures exposed to 1 μM fingolimod (right panels). (B, D) Frequency of CD25 and CD150 expressing monocytes in unstimulated and LPS-stimulated cultures in the absence or presence of increasing concentrations of fingolimod. Data were obtained from 5 independent experiments. (E) Graphs represent fingolimod-mediated inhibition of activation markers induced at 2 LPS doses. Data were obtained from 2 to 5 experiments. Bars represent SEM. *p < 0.05; **p < 0.01. FSC = forward scatter.

