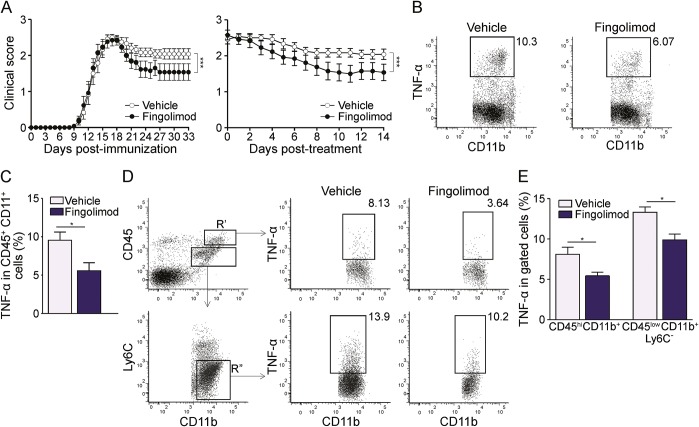
Figure 4. Therapeutic administration of fingolimod during EAE reduces myeloid cell activation in the spleen and CNS.
(A) Clinical expression of MOG 35-55 peptide-induced experimental autoimmune encephalomyelitis (EAE) in fingolimod-treated (n = 13, black dots) or vehicle-treated (n = 12, white dots) mice. Drug or vehicle were administered daily starting 3 days after disease onset. Left graph shows mean clinical scores from day of immunization, right graph depicts mean clinical score according to treatment duration. (B) Representative stainings for tumor necrosis factor–α (TNF-α) production by CD45+ CD11b+ spleen myeloid cells from vehicle- and fingolimod-treated EAE mice. (C) Frequency of TNF-α–producing myeloid cells in vehicle-treated (n = 5) and fingolimod-treated EAE (n = 4) mice. (D) Representative stainings for TNF-α production by CNS myeloid cells from vehicle-treated and fingolimod-treated EAE mice. Left panels show gating strategy. R′: CD45hiCD11b+ blood-borne CNS infiltrating myeloid cells. Gate R″: CD45lowCD11b+Ly6C− CNS resident microglia. Middle and right panels depict representative stainings for TNF-α production by CNS infiltrating (upper) or resident (lower) myeloid cells from vehicle-treated and fingolimod-treated EAE mice. (E) Frequency of TNF-α–producing CNS myeloid cells in vehicle-treated (n = 5) and fingolimod-treated EAE mice (n = 5). Representative animals of the mean EAE clinical score (A) were analyzed in C and E. Bars represent SEM. *p < 0.05; ***p < 0.001.

