
Fig. 3.
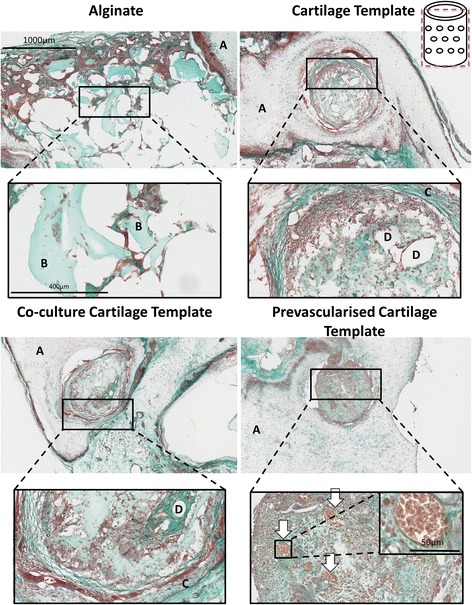
Masson’s Trichrome of the groups after 4 weeks implantation. Images were taken at 5×, 20× and 40×. Schematic of the plane in which the section was taken in in the top right corner. A nanofibre mesh, B islands of alginate, C sGAG rich encapsulation, D area of degradation, arrows vessels complete with red blood cells