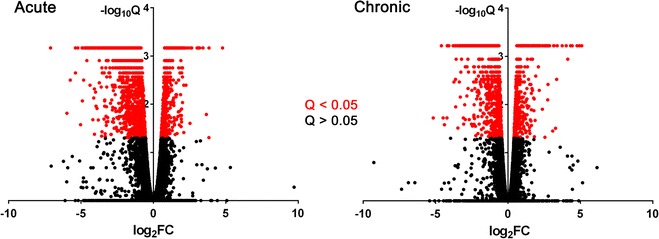
Fig. 3.

Volcano plots for differential gene expression in the acute and chronic phases of SCI. Colors represent Q < 0.05 (red) and Q > 0.05 (black) for differential expression testing. The overall magnitude of differential gene expression was greater in the acute phase, as evidenced by a larger median absolute value of log2FC (1.27 acute versus 0.99 chronic; P < 0.001) for differentially expressed genes. FC fold change (AN FKPM divided by SD FKPM). Q, false discovery rate-adjusted P value
