
Fig. 3.
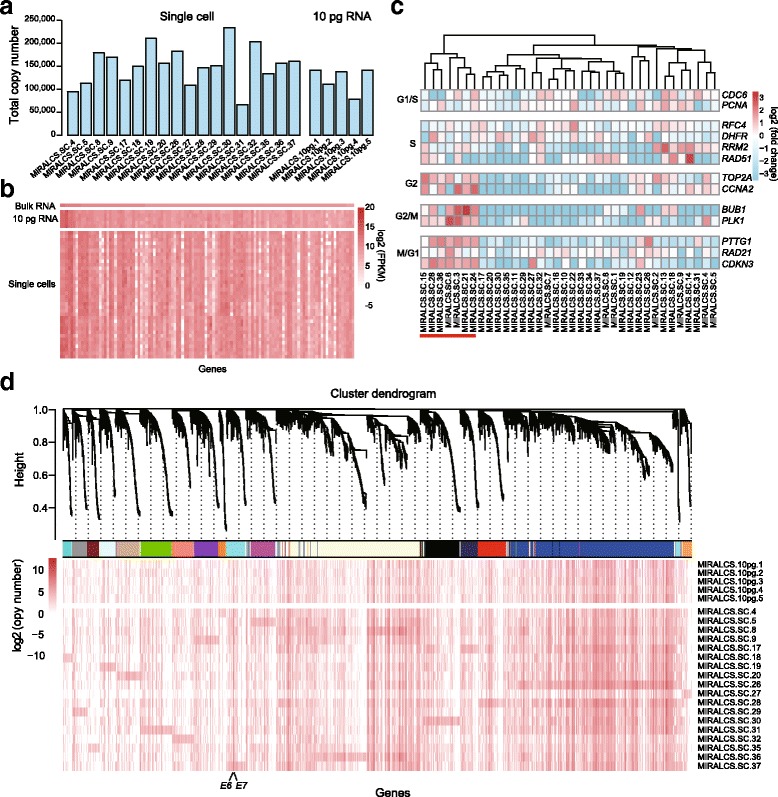
Heterogeneity of gene expression in HeLa S3 single cells. a The mRNA molecular number in single cells and 10 pg RNA replicates. b The heat map of the FPKM values of extremely highly expressed genes (FPKM > 500 in bulk RNA) in single cells and 10 pg replicates. c Single-cell subpopulations identification based on cell cycle relative genes. The cells with underline are in G2/M phase. d Gene co-expression modules derived from 19 single cells based on RNA molecular number (modules are distinguished by colors). The detailed of each module stands for were shown on Additional file 4: Table S7. The weighted gene correlation network was constructed using the WCGNA R package [38]