
Fig. 4.
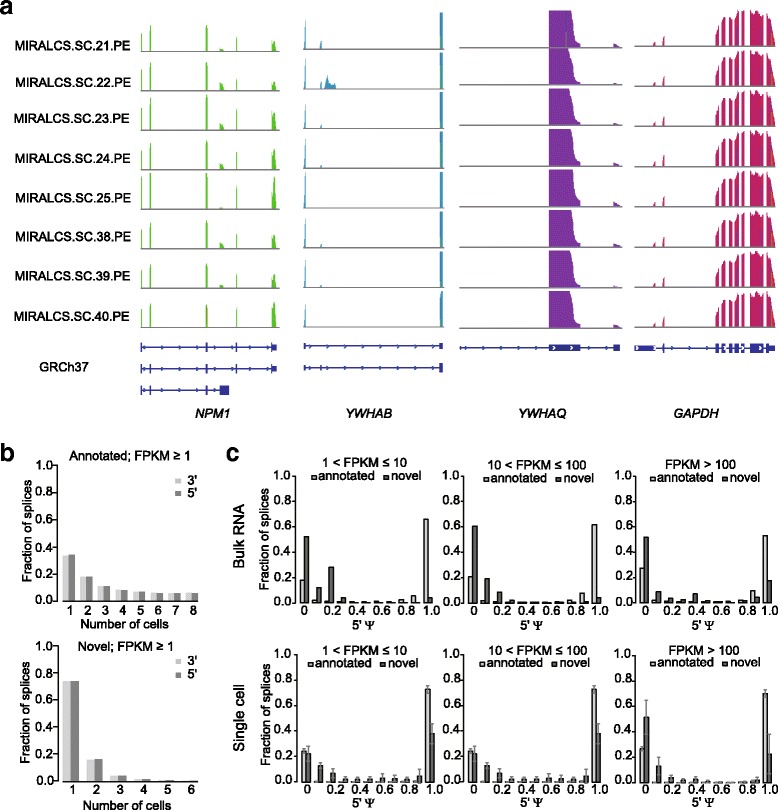
Heterogeneity of alternative splicing and distributions of splices in in single cells. a The sequencing depth for genes of NPM1, YWHAB, YWHAQ and GAPDH in single cells. b The frequency distribution of detected annotated and novel spliced junctions. c The distributions of the ψ scores of annotated and novel spliced junctions in the bulk RNA (upper) and single cells (lower)