
Fig. 2.
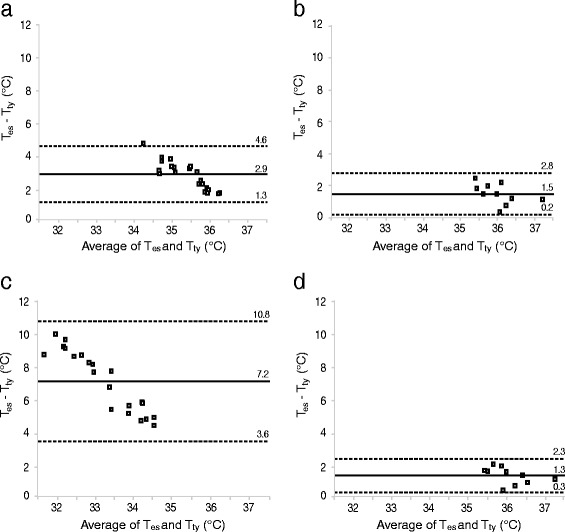
Bland-Altman plots of individual data for mean Tes and Tty at room temperature (a, without insulation of the ear; b, with insulation) and low temperature (c, without insulation of the ear; d, with insulation). The solid line is the mean of differences and the dashed lines are the limits of agreement (mean ± 1.96 standard deviation)