
Fig. 3.
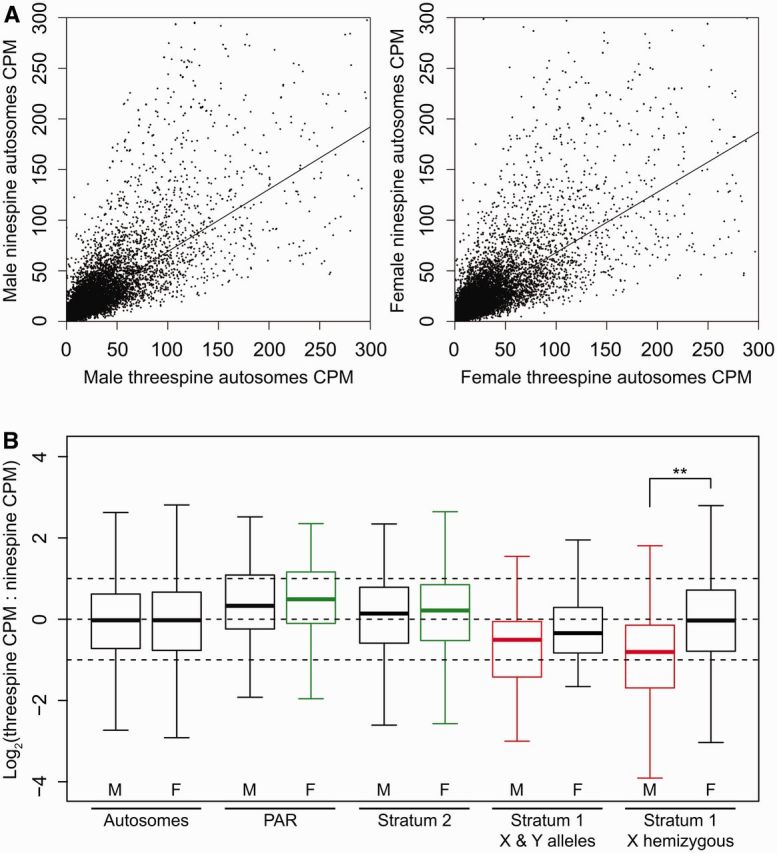
Threespine stickleback gene expression compared with outgroup gene expression levels. (A) Gene expression of autosomal genes in the threespine stickleback (Gasterosteus aculeatus) is highly correlated with gene expression of orthologous genes in the ninespine stickleback (Pungitius pungitius) (males: N = 24,308 genes; females: N = 24,308 genes; CPM: counts per million). Linear regression lines are shown. (B) Gene expression levels in male and female threespine stickleback and male and female ninespine stickleback were normalized to their respective median autosomal gene expression. Median threespine stickleback:ninespine stickleback expression ratios were measured across the autosomes and the threespine stickleback sex chromosomes. Medians that are significantly greater than ancestral levels are indicated in green, medians that are significantly less than ancestral levels are indicated in red, and medians that do not differ from ancestral levels are indicated in black (Mann–Whitney U test, mu = 0, autosomes and the sex chromosomes were corrected for multiple comparisons separately). Within each region (autosomes: N = 24,308 genes; PAR: N = 64 genes; stratum 2: N = 496 genes; stratum 1 X and Y alleles: N = 65 genes; stratum 1 X hemizygous: N = 522 genes), significant differences between males and females are marked with asterisks (pairwise Mann–Whitney U test, corrected for multiple comparisons, **P < 0.05). “X & Y alleles” refer to the genes within stratum 1 that retain coding sequence on the Y chromosome. Whiskers are 1.5 × the interquartile range. Outliers are not shown.