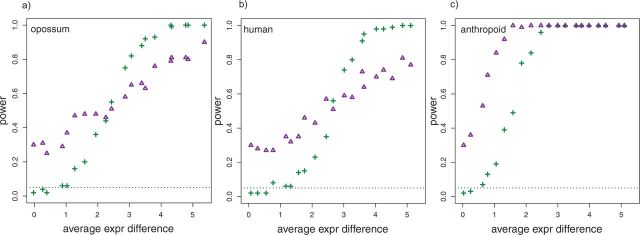
Figure 2.
Power is shown as a function of average expression difference between the species on the shifted branch and the rest of the phylogeny. Power is shown for traditional ANOVA (crosses) and the EVE method “phylogenetic ANOVA” (triangles) for shifts on the (a) opossum, (b) human, and (c) anthropoid branches.

