
Figure 3.
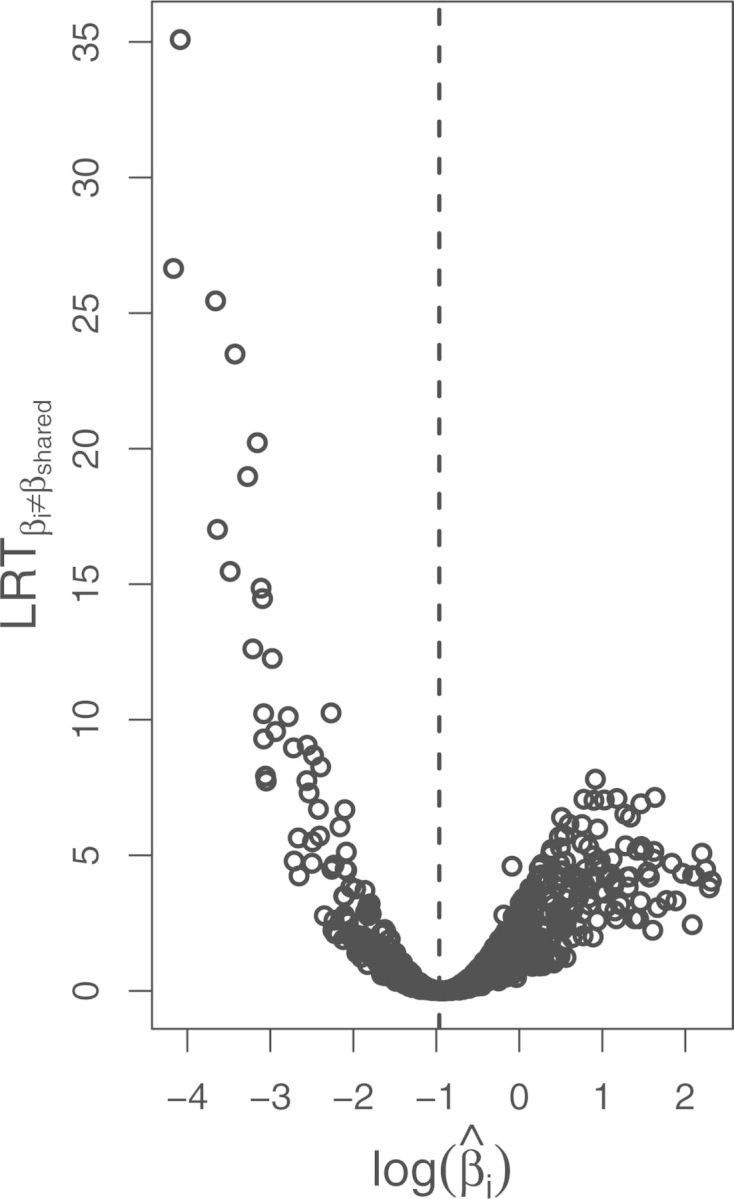
The test for a gene with varying from was computed for each gene. Those likelihood ratio test statistics () are plotted against the log of the parameter estimated for each gene () in a volcano plot. The dashed line indicates the value of .
Official websites use .gov
A
.gov website belongs to an official
government organization in the United States.
Secure .gov websites use HTTPS
A lock (
) or https:// means you've safely
connected to the .gov website. Share sensitive
information only on official, secure websites.
The test for a gene with varying from was computed for each gene. Those likelihood ratio test statistics () are plotted against the log of the parameter estimated for each gene () in a volcano plot. The dashed line indicates the value of .