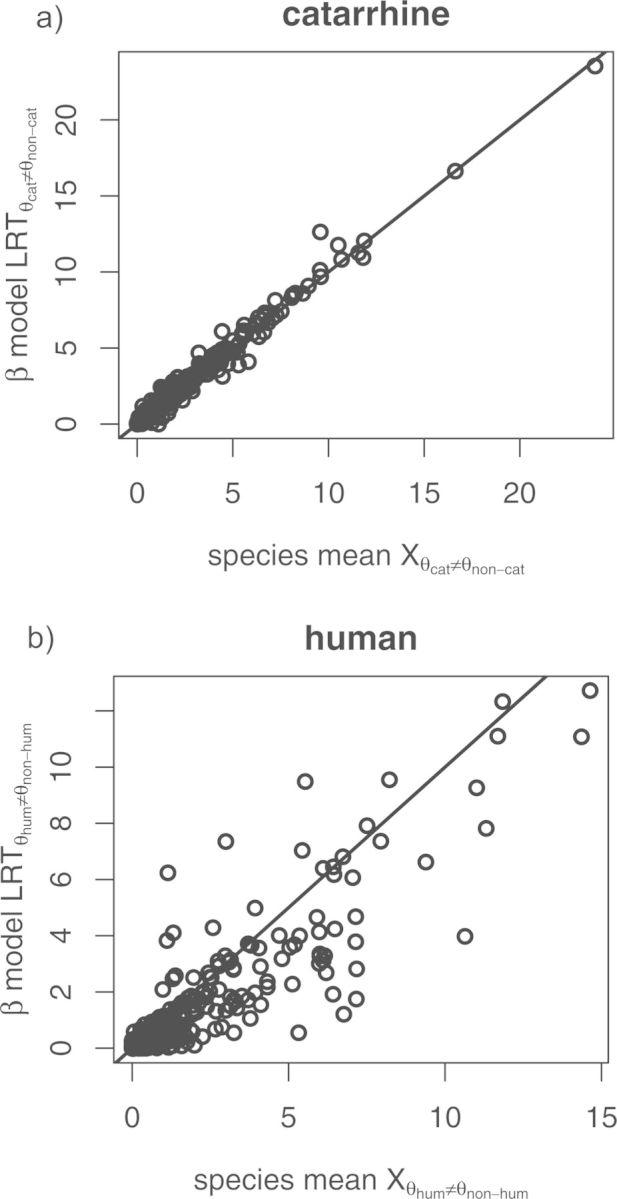
Figure 5.

Each plot shows (a) and (b) calculated using the EVE model (-axes) and SM model (-axes) as implemented in this analysis. The line indicates .

Each plot shows (a) and (b) calculated using the EVE model (-axes) and SM model (-axes) as implemented in this analysis. The line indicates .