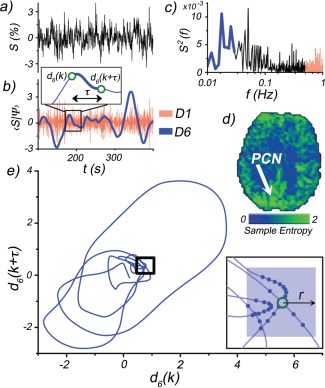
Figure 1.

A depiction of the wavelet‐based regularity analysis. a) A representative rs‐fMRI signal selected from voxel located within the precuneus (PCN) of a representative subject (MNI coordinates: −10, −52, 26), b) SWT of rs‐fMRI signal. Only two scales shown for illustrative purposes: D1 (red) and D6 (blue). The intensities of the D1 scale fluctuations are used to estimate the noise level. Inset depicts an example of an m = 2 subsequence construction. The kth subsequence (d(k), d(k + τ)) is formed from time points separated by a time delay τ (first minimum in the auto‐mutual information function). This is performed for each scale Dj. c) Power spectrum of rs‐fMRI signal. High (red) and low (blue) frequency bands show where D1 and D6 wavelet scales exhibit sensitivity, respectively. d) Sample entropy map of the D6 scale. Arrow indicates PCN location of rs‐fMRI signal. e) Phase space plot of subsequences (m = 2) taken from D6 scale time course. Inset: outlined region magnified, with solid blue points indicating recurrent patterns within r, of the kth subsequence (open green circle). [Color figure can be viewed in the online issue, which is available at http://wileyonlinelibrary.com.]
