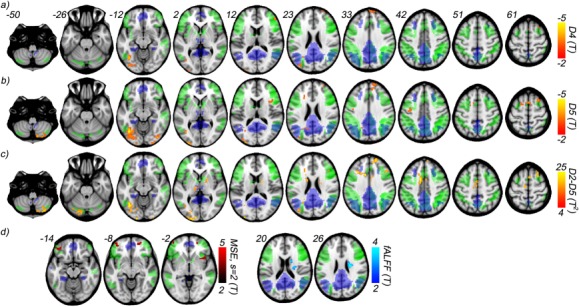
Figure 6.

Voxelwise comparison between healthy (CDR 0) and impaired (CDR 0.5) cognitive function groups from HASD cohort using wavelet‐based regularity analysis, MSE analysis, and fALFF. Results from two sample t‐tests show decreased regularity in the CDR = 0.5 group at scales a) D4, corresponding to the frequency range 0.028–0.014 Hz, and b) D5, corresponding to the frequency range 0.014–0.007 Hz. c) Two sample multivariate t‐tests performed voxelwise across scales D2–D5 show an extended number of regions affected. d) MSE and fALFF two sample t‐test (univariate) results are shown. MSE differences are observed only for s = 2 and appear over a far narrower range of slices. Similarly, fALFF differences occur within a single cluster. All results are significant to P < 0.005, and further cluster corrected for P < 0.05, with a cluster size minimum of 60. Two RSN masks, defined using group ICA across both groups, are shown for comparison: posterior default mode (blue), and a composite of the left and right executive control (green). [Color figure can be viewed in the online issue, which is available at http://wileyonlinelibrary.com.]
