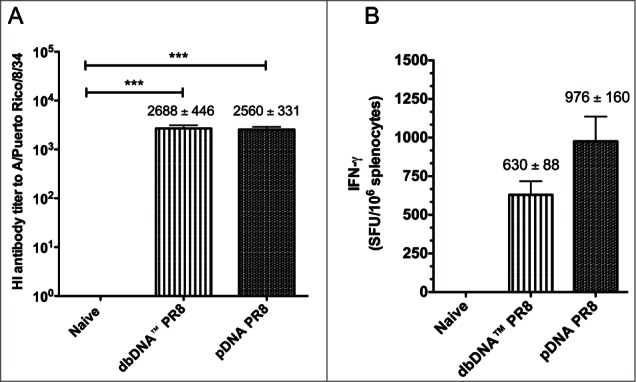
Figure 4.

Comparison of host responses to DNA vaccination. (A) Hemagglutination inhibition (HI) antibody titers from the challenge groups of mice (n = 10/group) 3 weeks after the final immunization and prior to viral challenge. (B) The number of IFN-γ secreting splenocytes 3 weeks after the final vaccination. Splenocytes were stimulated with H1HA pooled peptides and IFN-γ secretion was reported as spot forming units (SFU) per million splenocytes. Group mean ± SEM are reported. ***, P < 0.0005 for DNA HI antibody titers compared to naive.
