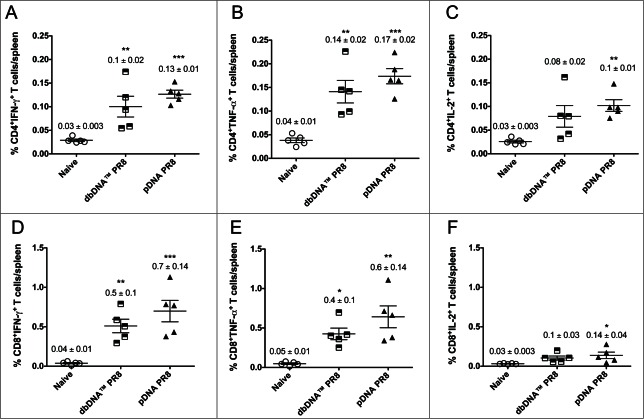
Figure 5.
Cytokine frequencies and phenotypic profiles of specific CD4+ and CD8+ T cells following DNA immunizations. Cytokine recall responses to dbDNA™ PR8 and pDNA PR8 were measured 3 weeks after the final immunization by ICS and flow cytometry. Multiparameter flow cytometry was used to determine the percentages of multifunctional CD4+ T cell (A–C) and CD8+ T cell (D–F) cytokines. The graphs show the percentages of each cytokine subpopulation to H1HA pooled consensus peptide stimulation. Background staining from cells stimulated with medium alone has been subtracted. Data represent the mean ± SEM of 5 mice per group. Cytokine responses for animals vaccinated with dbDNA™ PR8 or pDNA PR8 were compared to naïve. ***, P < 0.0005; **, P < 0.005; *, P < 0.05.

