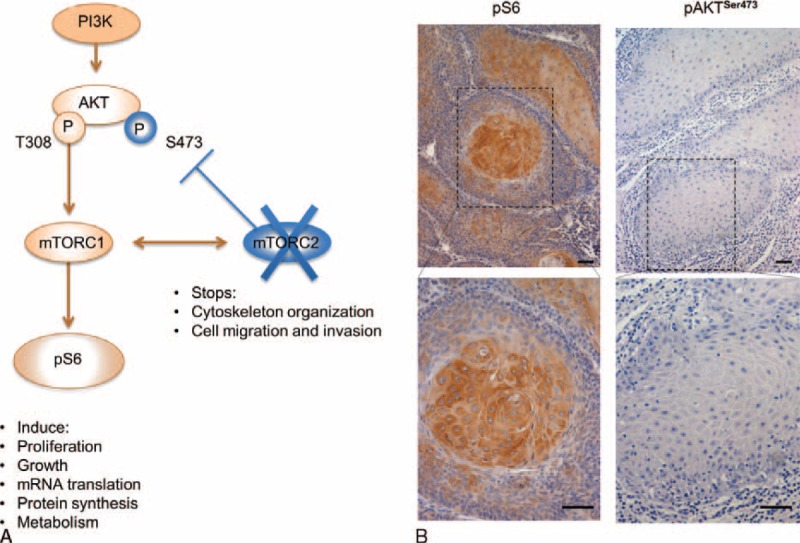
FIGURE 2.

mTORC1 is active in keratoacanthomas. (A) Schematic representation of the PI3K/mTOR pathway showing that activation of S6 (phospho-S6 or pS6) results from mTORC1 complex activation, whereas phosphorylation of AKT at Ser 473 (pAKTSer473) results from a feedback loop triggered mTORC2 complex activation. A negative feedback loop causes repression of pAKT activation when mTORC2 is suppressed. (B) Representative microphotograph of immunostaining for pS6 and pAKTSer473 in keratoacanthomas. Note that tumor cells are positive for pS6 in the cytoplasm (IHC-200×; insert 400×).
