
FIGURE 2.
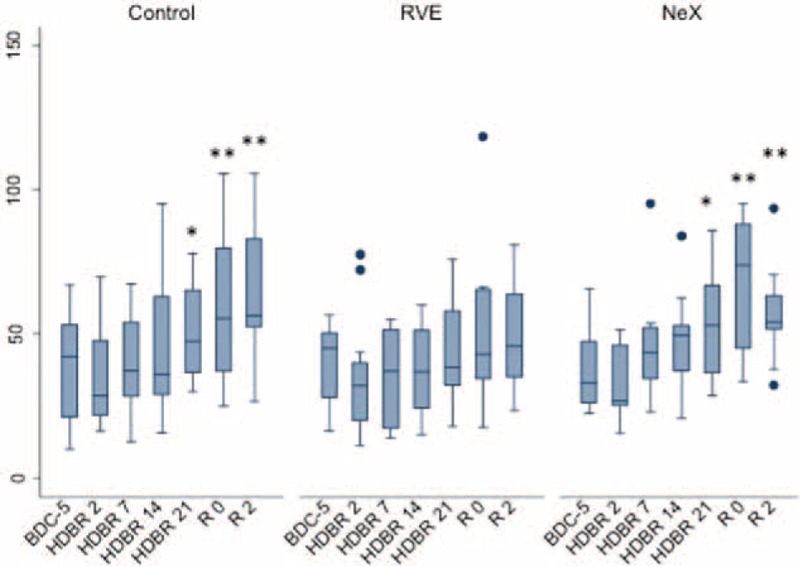
Effect of bed rest on VELINDEX. Longitudinal observation of the effects of bed rest and re-ambulation on VELINDEX. At HDBR2, VELINDEX reached a minimum and reached baseline levels at the end of bed rest (HDBR21) in all 3 groups. In the control and in the NeX groups, VELINDEX was significantly higher at R0 and R2 compared to baseline (BDC-5, P < 0.01). Data are expressed as means ± SD. ∗P < 0.05; ∗∗P < 0.01; ∗∗∗P < 0.001 compared to the respective BDC-5. HDBR = head down bed rest, SD = standard deviation.