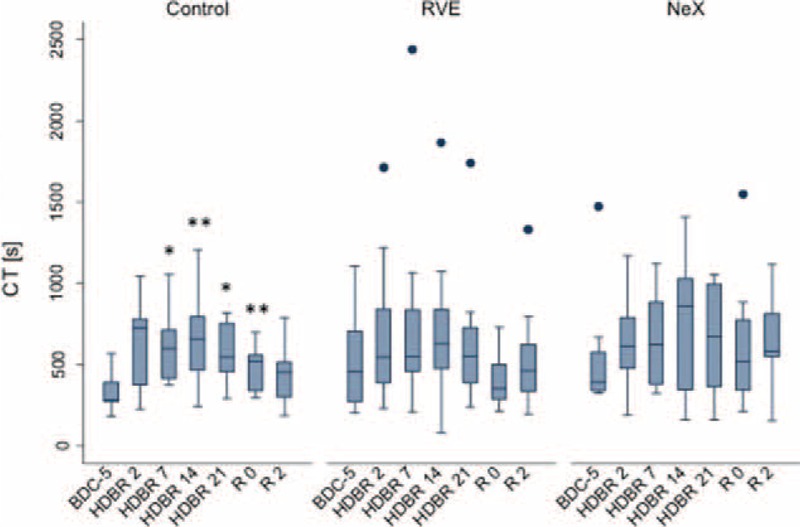
FIGURE 4.

Effect of bed rest on CTs. Longitudinal observation of the effect of bed rest and re-ambulation on CTs. In all 3 groups, CT values were prolonged during bed rest and returned to baseline levels in the re-ambulation period. Data are expressed as means ± SD. ∗P < 0.05; ∗∗P < 0.01; ∗∗∗P < 0.001 compared to the respective BDC-5. CT = coagulation time, SD = standard deviation.
