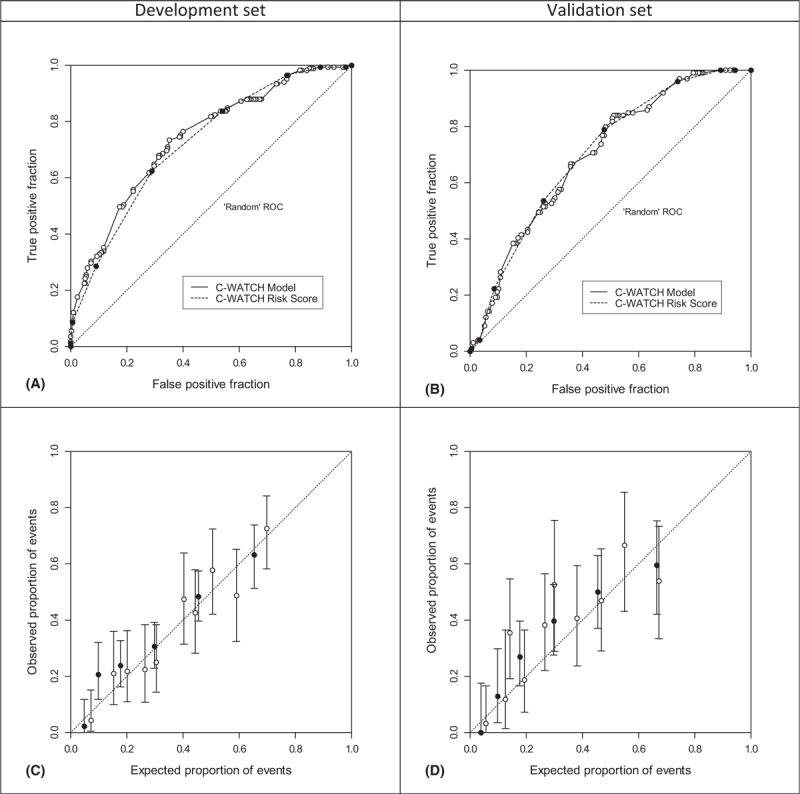
FIGURE 2.

Area under ROC curve discrimination between patients with complication (yes/no) in the development set (A: C-WATCH model, area under ROC curve 0.739, and C-WATCH score, AUC 0.723) and the validation set (B: AUC 0.700 and 0.704, respectively). Calibration plots of both models (white points) and risk score (black points) in the development set (C) and validation set (D). Whiskers denote 95% confidence intervals (Clopper–Pearson). ROC = receiver operating characteristic.
