FIGURE 1.

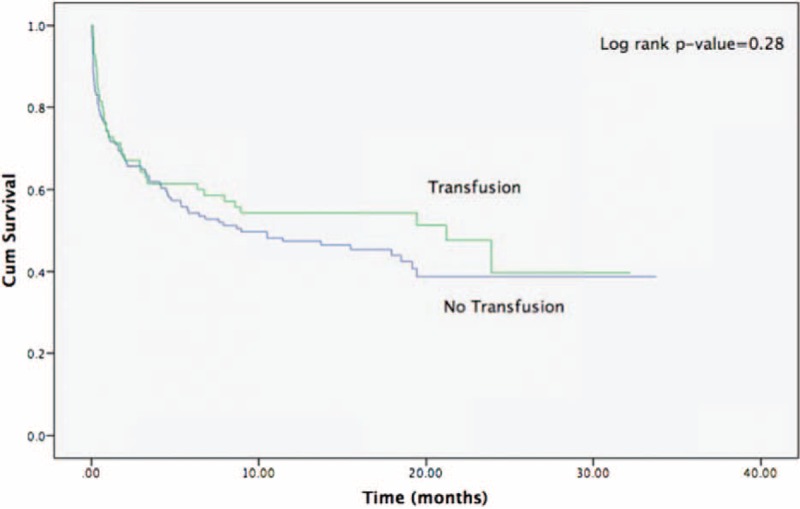
Kaplan–Meier survival curves for the whole study population (both severe and nonsevere anemia) according to transfusion therapy.

Kaplan–Meier survival curves for the whole study population (both severe and nonsevere anemia) according to transfusion therapy.