


FIGURE 3.
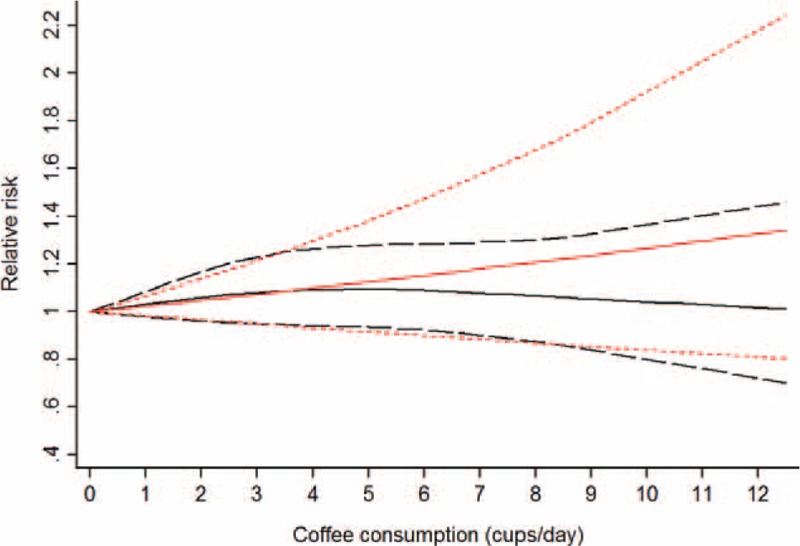
Dose–response analyses of 3 cups/day increment of total coffee consumption and risk of gastric cancer. The black solid line and the black long dashed line represent the estimated RRs and corresponding 95% CIs for the nonlinearity. The red solid line and the red short dashed line represent the estimated RRs and corresponding 95% CIs for the linearity. CI = confidence interval, RR = relative risk.