
. 2015 Sep 25;94(38):e1640. doi: 10.1097/MD.0000000000001640
Copyright © 2015 Wolters Kluwer Health, Inc. All rights reserved.
This is an open access article distributed under the Creative Commons Attribution-NonCommercial-NoDerivatives License 4.0, where it is permissible to download, share and reproduce the work in any medium, provided it is properly cited. The work cannot be changed in any way or used commercially. http://creativecommons.org/licenses/by-nc-nd/4.0
FIGURE 7.
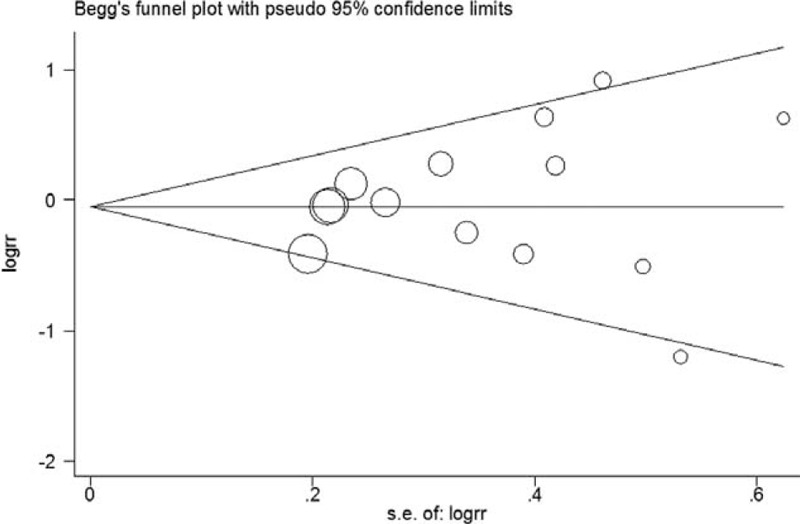
Funnel plot for the second highest coffee consumption.