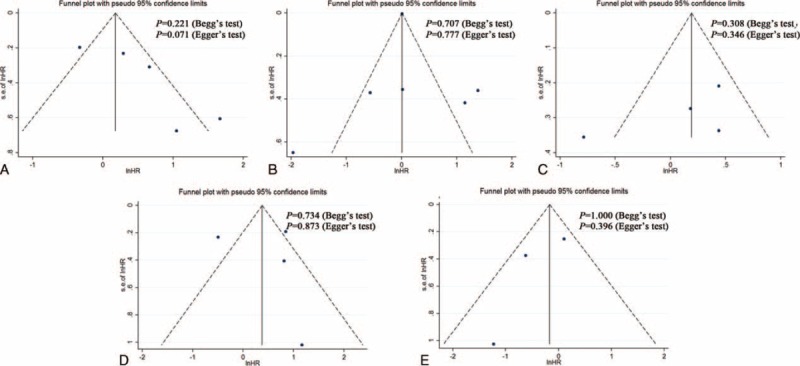
FIGURE 4.

Funnel plots, Begg and Egger’ test results for the evaluation of publication bias. (A) HIF-1α and OS, (B) HIF-1α and CSS, (C) HIF-1α and PFS, (D) HIF-2α and CSS, (E) HIF-2α and PFS. CSS = cancer-specific survival, HIF = hypoxia-inducible factor, HR = hazard ratio, OS = overall survival, PFS = progression-free survival.
