
FIGURE 2.
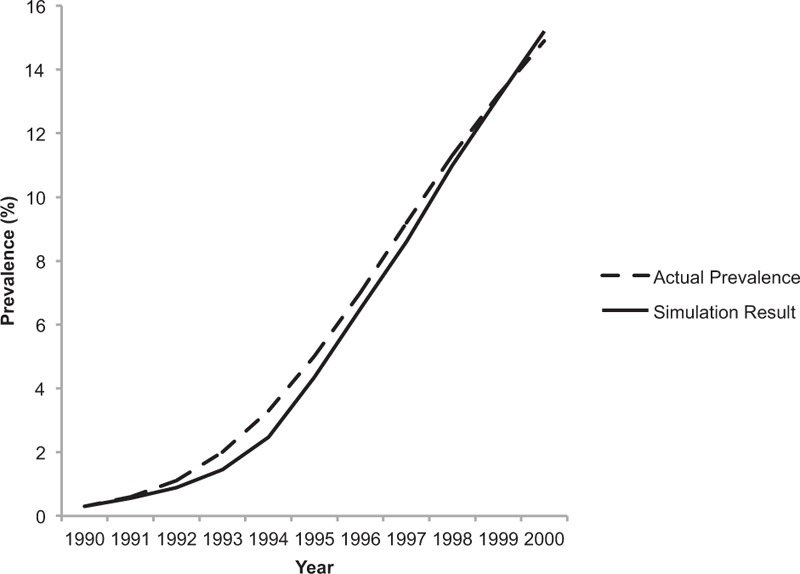
Model calibration. It shows the result of the calibration phase. We used demographic and epidemiologic data from South Africa to parameterize our model. It compares the HIV prevalence generated by the model (solid line) with the historical prevalence (dotted line) observed in South Africa from 1990 to 2000.