


. 2015 Sep 18;94(37):e1500. doi: 10.1097/MD.0000000000001500
Copyright © 2015 Wolters Kluwer Health, Inc. All rights reserved.
This is an open access article distributed under the Creative Commons Attribution License 4.0, which permits unrestricted use, distribution, and reproduction in any medium, provided the original work is properly cited. http://creativecommons.org/licenses/by/4.0
FIGURE 1.
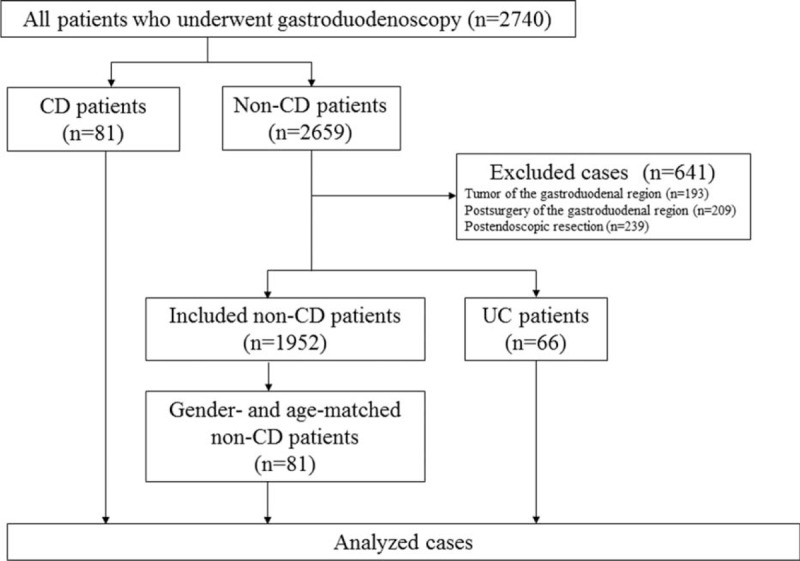
A flow chart of the present study.