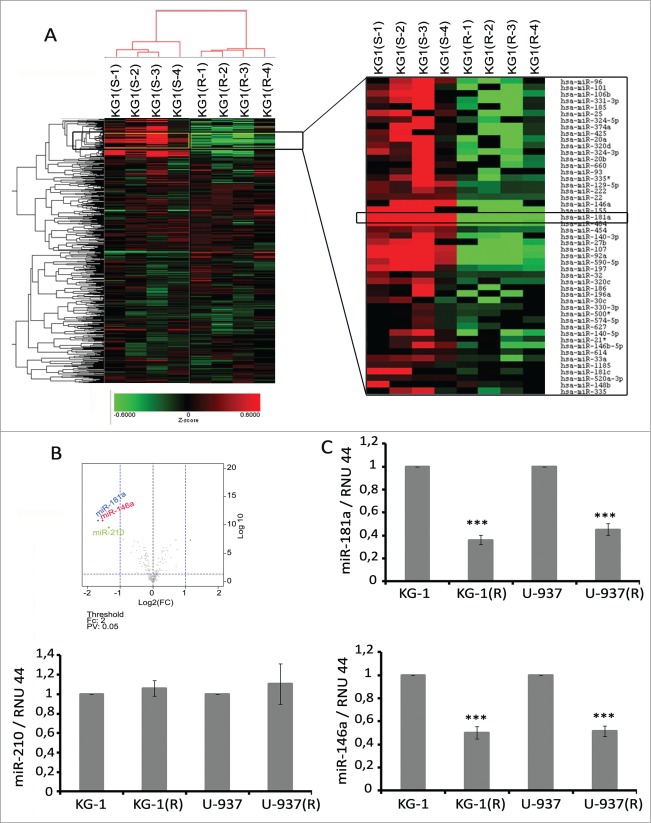
Figure 2.
Microarray analysis of the effects of daunorubicin resistance acquisition by leukemia cells on miRNA expression. (A) Heat map of regulated miRNAs in KG-1 sensitive (S-1–S-4) or resistant (R-1–R-4) cells compared to parental cells. Red signifies upregulation, green downregulation. ArrayExpress accession: E-MTAB-2837, Username: Reviewer_E-MTAB-2837, Password: yikpqsrb. (B) Volcano plot of miRNA expression (log2 fold change) and adjusted P values for KG-1(R). (C) miR-181a, miR-146a and miR-210 expression in DNR-sensitive or -resistant (R) KG1 and U937 cells. Expression levels of RNU44 were used as endogenous control. One representative of at least three separate experiments is shown.

