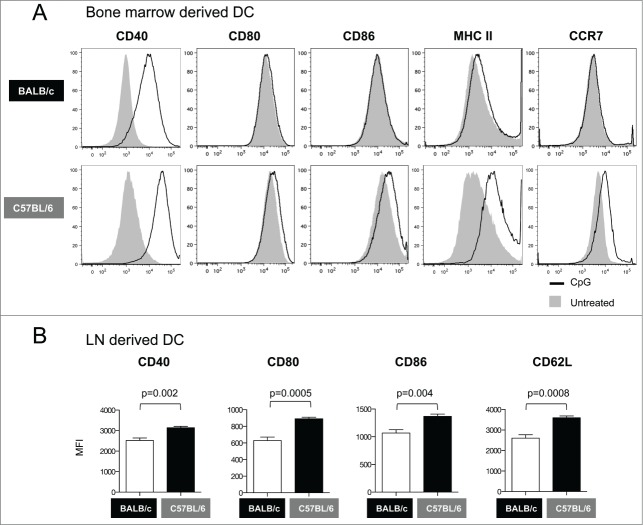
Figure 3.
Phenotypic analysis of DC from BALB/c and C57BL/6 mice. (A) Bone marrow derived DCs were treated with CpG for 12 hours and their maturation phenotype was monitored by flow cytometry. The overlays show the expression of co-stimulatory molecules (CD40, CD80 and CD86), MHC II and CCR7 in untreated (solid histograms) and CpG-treated DC (open histograms). (B) Phenotypic analysis of DC from lymph nodes ex vivo. Graphs show the Mean Fluorescence Intensity (MFI) for CD40, CD80, CD86, and CD62L in DC from inguinal lymph nodes obtained from BALB/c and C57BL/6 mice. p values (unpaired t test) are given.

