Figure 4.

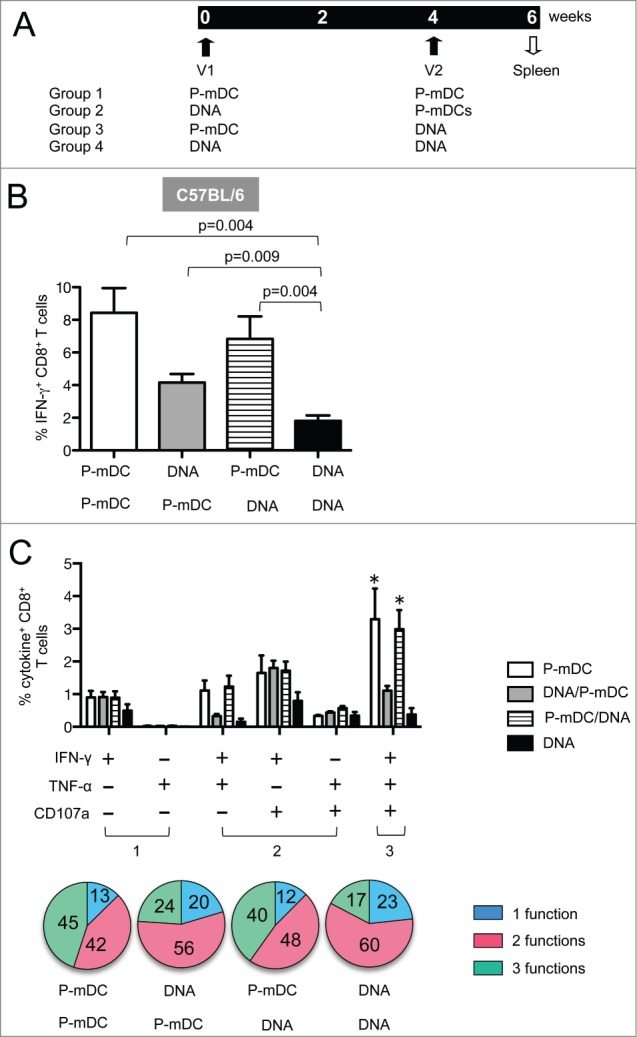
Env-specific cellular immune responses induced by prime-boost strategies. (A) Vaccination protocol listing the 4 vaccine platforms. C57BL/6 mice were immunized twice (week 0 and 4) and 2 weeks later splenocytes were collected and analyzed by flow cytometry for antigen-specific cellular responses. (B) Frequency (mean ± SEM) of Env-specific IFN-γ+ CD8+ T cells in vaccinated mice (one representative out of 3 experiments). p values (Mann-Whitney test) are given. (C) Frequency (mean ± SEM) of Env-specific CD8+ T cells with 1 function (IFN-γ+ or TNF-α+), 2 functions (IFN-γ+TNF-α+, IFN-γ+CD107a+, TNF-α+CD107a+) and 3 functions (IFN-γ+TNF-α+CD107a+) in CD8+ T cells. * p <0.05 (Anova): P-mDC VS DNA, P-mDC/DNA VS DNA. The general distribution of polyfunctional CD8+ T cells is shown in pie charts.
