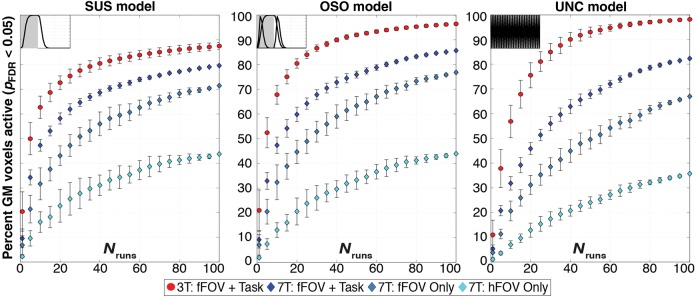
Figure 2.
Evolution of activation extent in GM as a function of runs entering the analysis (Nruns) for both the 3T and 7T data for pFDR < 0.05. Each panel shows results for a different response model. Markers track expansion of GM activation as Nruns increases for averages of all 3T subjects (red), the same fFOV + Task condition at 7T (dark blue), “fFOV Only” (blue), and “hFOV Only” (light blue). Error bars for 3T data show standard deviation across subjects, while error bars for 7T data represent standard deviation across permutations within a single subject.

