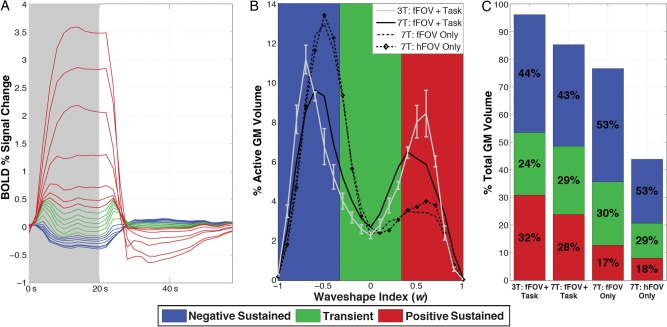
Figure 6.
(A) Relative size of mean responses, as categorized by w into 20 bins in Figure 1D, for active GM voxels in the 7T fFOV + Task subject. Positively sustained, transient, and negatively sustained responses are colored in red, green, and blue, respectively. (B) Histograms of w as a percentage of active GM for each subject (average of 3T subjects shown with standard error bars), showing the relative abundance of each response type. (C) Bar graph showing contributions of each response type relative to total GM volume for all 7T and the average of the 3T subjects. The percentage of GM activation that each response type is responsible for in each subject is overlaid in black.

