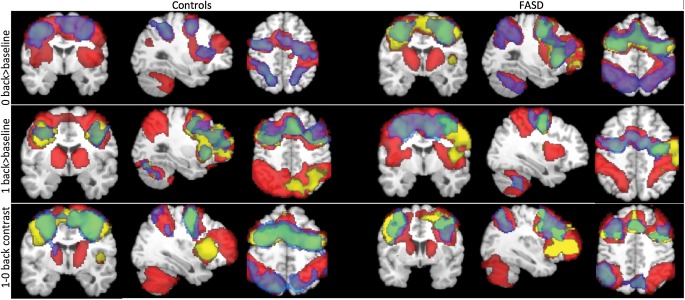
Figure 6.
Overlap of activations between the 3 geographical sites for N-back conditions. Images presented in radiological orientation. Covariates included age and scan interval. Activations significant at z = 1.7, cluster corrected at P < 0.05. SA (red), LA (blue), SD (yellow). Green regions indicate overlap between LA and SD.

