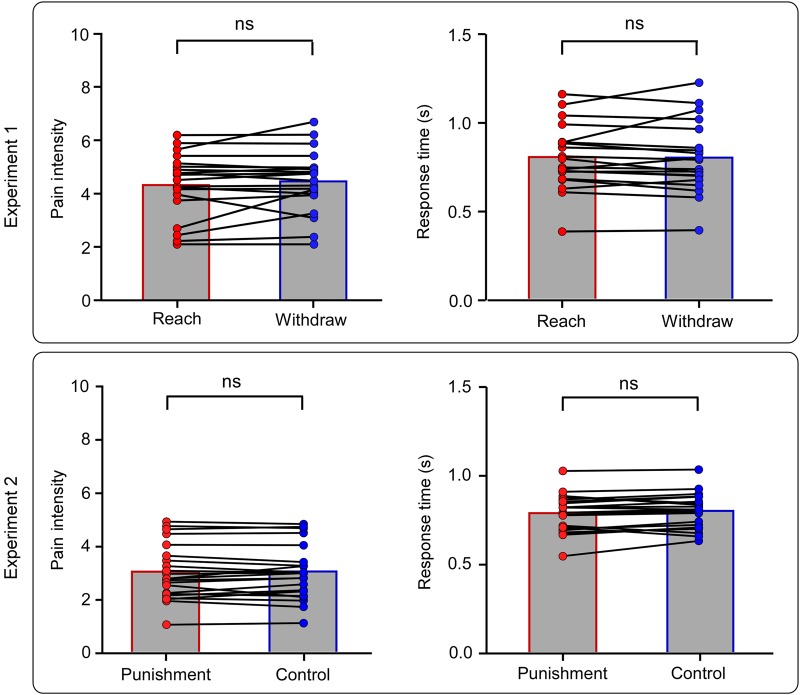
Figure 3.
Behavioral results. Single-subject pain intensity ratings and response times for the experimental conditions of Experiments 1 (n = 20) and 2 (n = 22). Columns define group averages. ns: non-significant. Reaction time data are presented in Supplementary Figure 1.

