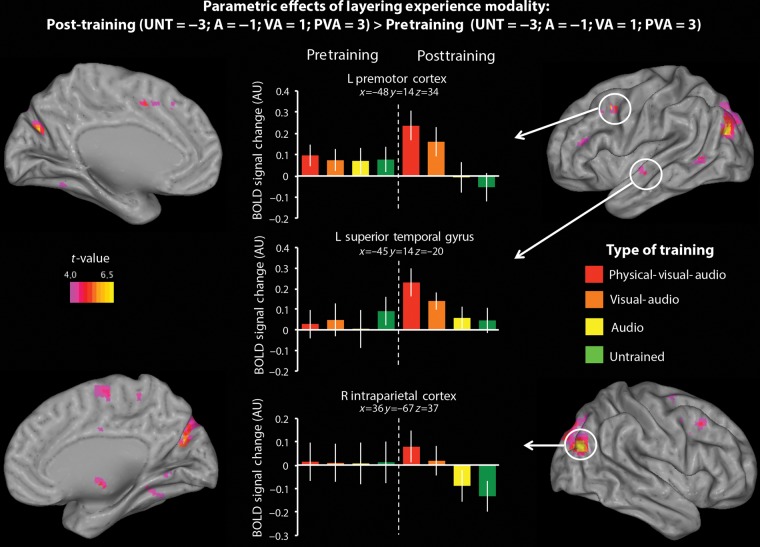
Figure 4.
Regions activated with increasing experience with an observed movement. Plots represent the percent signal change (AU: arbitrary units) within 3 AON regions that emerged from this contrast that met the established cluster-corrected threshold (PFWE-corrected < 0.05, k = 10 voxels; see Table 1 for complete listing of cluster-corrected regions to emerge from this contrast) for each type of stimulus (PVA, VA, A, and UNT), from the pre- and post-training scans. For the left premotor cortex, left superior temporal gyrus, and right intraparietal cortex, x, y, and z values are presented in MNI coordinates. Plots are included for illustration purposes only. Error bars indicate the across-subject standard error of the mean.

