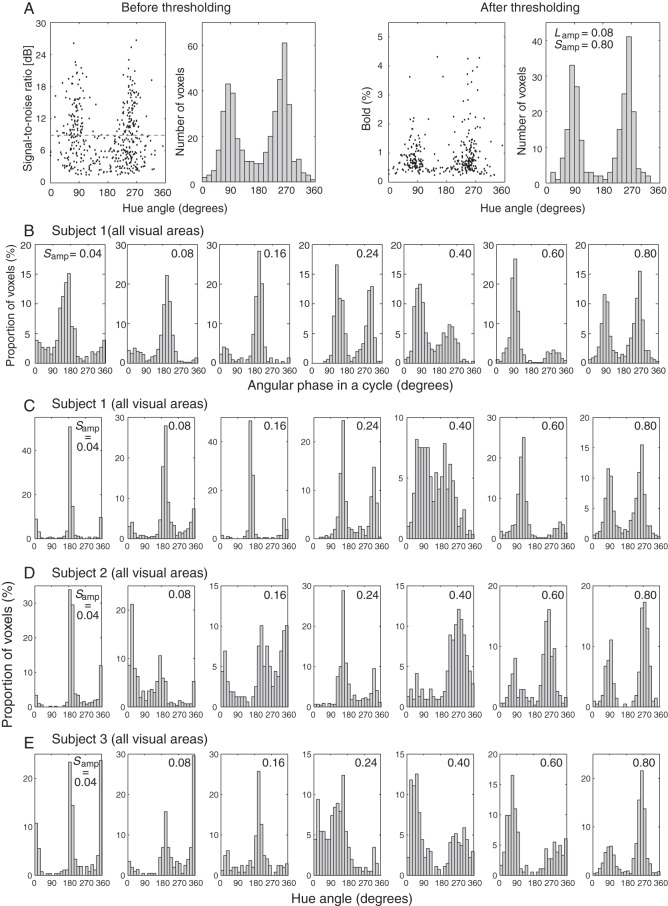
Figure 2.
Generation of hue-selective histograms. (A) An example hue-selective histogram from a representative subject before (left 2 panels) and after (right 2 panels) a signal-to-noise threshold of 8.3 dB was applied. The histogram was obtained with a condition of Samp = 0.80. All voxels in areas V1 through V4 were pooled together. (B) Hue-selective histograms from a representative subject, obtained under various Samp conditions. The abscissa represents the phase in a hue circle under each Samp condition. The ordinate represents the proportion of voxels after normalized to the total number of voxels in each ΔS/Sb condition. (C–E) Hue-selective histograms in visual areas V1 through V4 in each subject under all ΔS/Sb conditions. The abscissa now represents the unified hue angle, defined for a hue circle with Lamp = 0.08, Samp = 0.80, as illustrated in Figure 1A. See also Figure 3C and Supplementary Figures 1–3.

