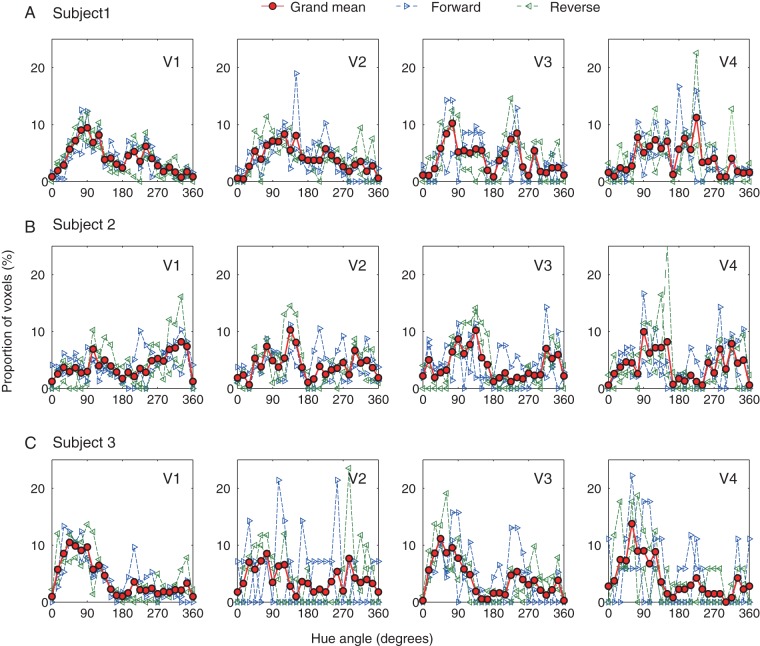
Figure 3.
Comparison and integration of histograms for forward and reverse order of hue presentations. (A–C) The results from V1 through V4 for 3 subjects. In each panel, broken lines with right-pointed and left-pointed triangles show normalized histograms where the hue changed in the forward direction (counter-clockwise direction in Fig. 1A) and reverse direction (clockwise direction in Fig. 1A), respectively, averaged across 2 runs for each direction. The criteria for voxel selection are the same as in the other experiments. See text for statistical comparisons between the 2 directions. The red solid line with circles in each panel indicates the grand mean histogram averaged from the 4 scans (2 in each direction), and the standard deviation is shown as the shaded area, together with the grand mean, in the corresponding polar plot in Figure 4.

