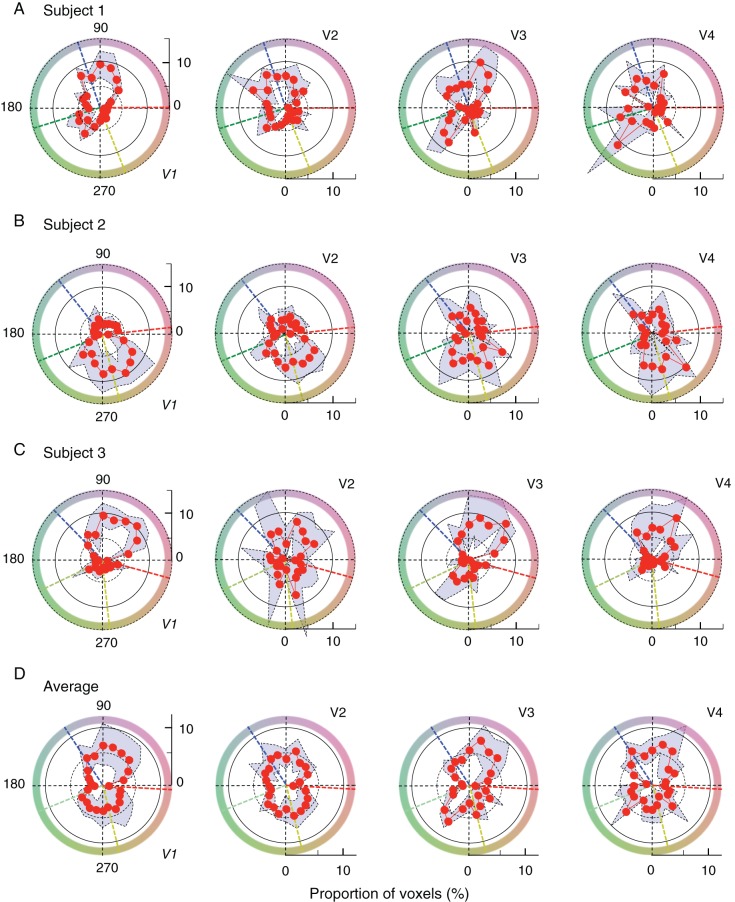
Figure 4.
Hue-selective angular histograms. (A–C) The results for V1 through V4 from individual subjects, and (D) the averages across the subjects. All histograms were normalized to the total number of voxels that passed selection criteria and are depicted in the polar angle, similar to the color space shown in Figure 1A. Each red curve and accompanying shaded area with dotted line contours indicate the mean and the range of standard deviations across measurements in 4 scans. In all panels, black dotted lines indicate the directions of opponent-color axes. In (A–C), dashed radial lines in different colors indicate the directions of unique hues, measured for individual subjects (see Supplementary Fig. 9 for comparison between histograms and unique hues). In (D), the directions of unique hues were averaged across the subjects.

