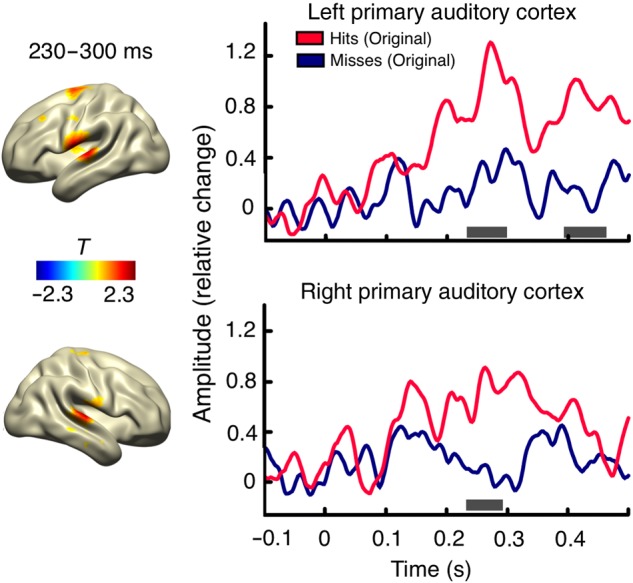
Figure 2.

Source level evoked responses for hits and misses. The spatial distribution of T-values for the statistical contrast (hits minus misses) is shown (left side) for the significant time period ranging from 230 to 300 ms (masked at P < 0.05). Time series are shown for evoked responses of hits (red) and misses (blue) for ROIs (left and right AI). Significant time periods are indicated with gray lines.
