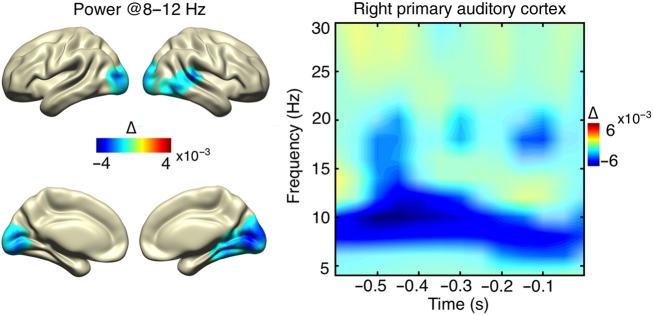
Figure 3.
Prestimulus source power modulations. The spatial distribution of relative change in power encompassing the significant time–frequency range (8–12 Hz, −600 to 0 ms) is shown on the left and the respective time–frequency distribution for the right AI on the right (significance marked with opaque colors), revealing a relative prestimulus decrease in alpha power for detected stimuli.

