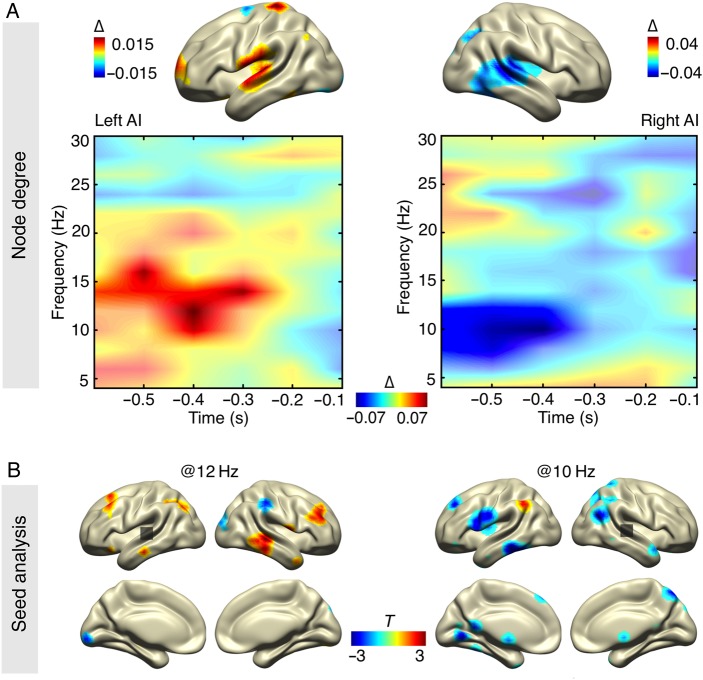
Figure 4.
Prestimulus network modulations. (A) The time–frequency representation of node degree (normalized change values) reveals a relative increase for detected stimuli (significance marked with opaque colors) for the left auditory cortex and a decrease for the right auditory cortex (in both cases spatial statistical maximum) in the alpha-band range (lower panel). Spatial mapping of significant time–frequency ranges (masked at P < 0.05, uncorrected) shows that sources for these effects are mainly situated in auditory cortices (upper panel). (B) Underlying connectivity patterns (masked at P < 0.05, uncorrected) for node degree effects are shown for seeds in left and right auditory cortex (statistical maximum in time–frequency–source space). The relative increase in node degree is mainly driven by an enhanced bilateral coupling between auditory processing regions of both hemispheres.

