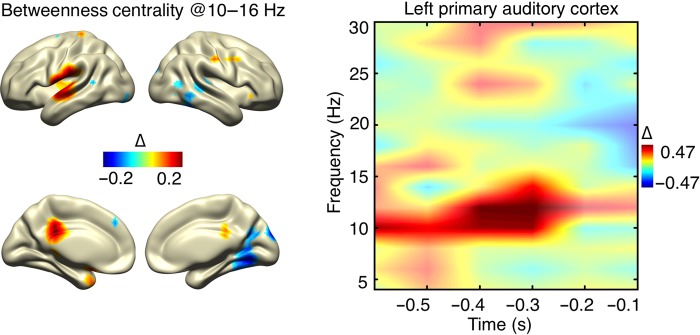
Figure 5.
Prestimulus betweenness centrality effects. The time–frequency representation of betweenness centrality (normalized change values) for the left auditory cortex (spatial statistical maximum) shows a relative increase for detected stimuli (significant values are marked with opaque colors). Spatial mapping of the significant time–frequency range reveals the main source in the left auditory cortex and an additional source in the posterior cingulated cortex.

