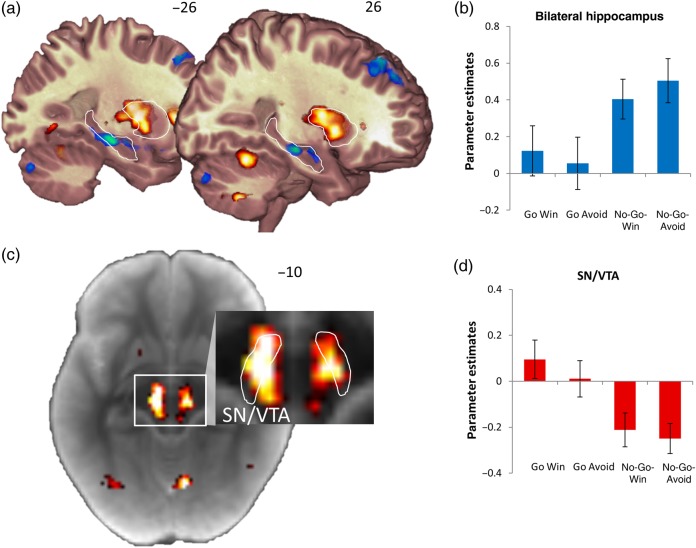
Figure 3.
(a) The main effects of action (red) and inaction (blue) on cue activity. The bilateral hippocampus and putamen are outlined for display purposes. (b) The bilateral hippocampus shows increased activation during the anticipation of inaction. (c) To localize the activity in the midbrain, the statistical map of the main effect of action was displayed on the average magnetization transfer weighted image of the subjects. The SN/VTA is within the outlined hyperintense stripe (Duzel et al. 2009). The contrast of the magnified display is optimized to differentiate midbrain structures. (d) The activation of the midbrain cluster shows a main effect of action. All activations are thresholded at P < 0.001 uncorrected. Error bars represent standard error of the mean.

