
Figure 6.
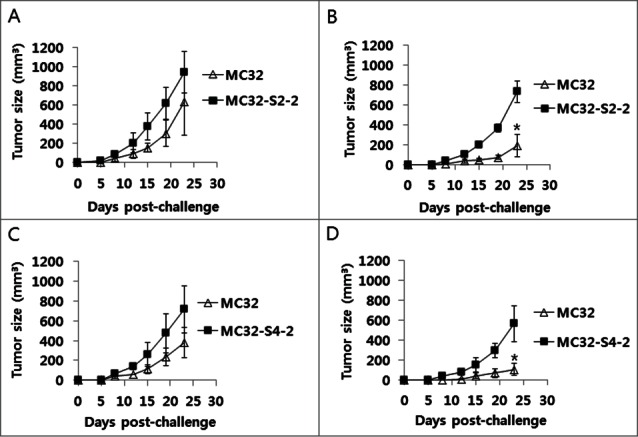
A lack of antitumor protective responses to MC32-S2–2 (A) and MC32-S4–2 cells in CEA DNA-immunized mice. Mice were immunized by IM-EP with CEA DNA vaccines at 0 and 1 weeks. At 3 weeks, the mice (B, D) were challenged s.c. with 1 × 10⁵ MC32 cells per mouse on the right flank and with 1 × 10⁵ MC32-S2–2 (B) and MC32-S4–2 cells (D) per mouse on the left flank. Age-matched control mice (A, C) were also challenged s.c. with 1 × 10⁵ MC32 cells per mouse on the right flank and with 1 × 10⁵ MC32-S2–2 (A) and MC32-S4–2 cells (C) per mouse on the left flank. Tumor sizes were measured at each time point and mean tumor volumes were recorded. The values and bars represent mean tumor volumes and the SD, respectively. *P < 0.05 using the independent sample's t test compared with MC32.