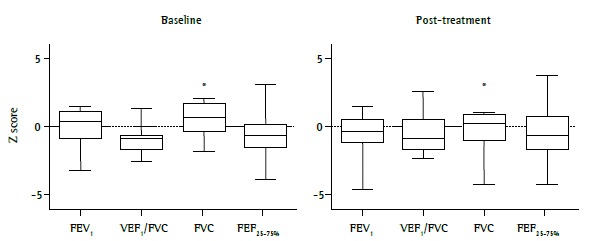
Figure 2. Lung function in children and adolescents with severe therapy-resistant asthma (n = 21) at baseline and at 6 months after treatment optimization. The variables are from pre-bronchodilator curves and are expressed as Z scores for the Global Lung Initiative reference values. *p = 0.015 .