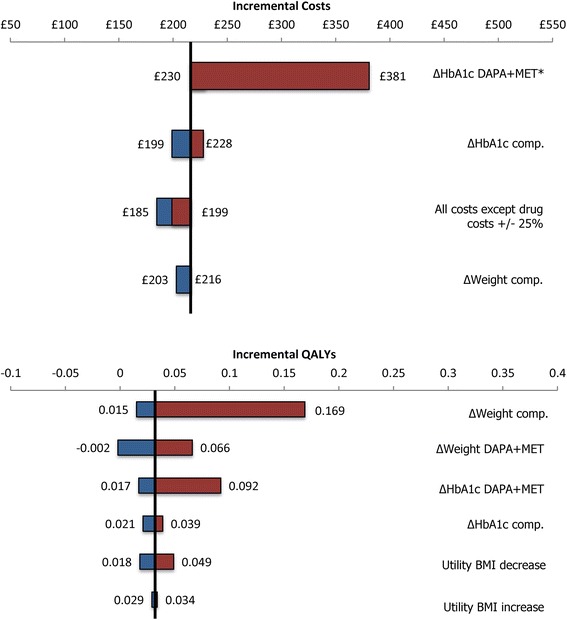
Fig. 1.

Univariate sensitivity analyses: Tornado graphs of incremental costs (top) and incremental QALYs (bottom). Variations of selected parameters are displayed as a range from the base case value (y-axis). Parameters include HbA1c change from baseline (∆HbA1c), weight change from baseline (∆Weight), BMI utility values and total non-drug costs. *It can be observed from the tornado graph for incremental costs that assuming a larger/smaller effect of dapagliflozin on HbA1c reduction would result in increased incremental costs. This can be explained by the model structure: in case of larger HbA1c reduction, patients would remain on the more expensive treatment option longer, whereas for the smaller HbA1c effect, patients would switch sooner to the next treatment line, leading to increased costs associated with AEs. Abbreviations: Comp., comparator; DAPA + MET, dapagliflozin added on to metformin; QALY, quality-adjusted life year; BMI, body mass index
