
Fig. 5.
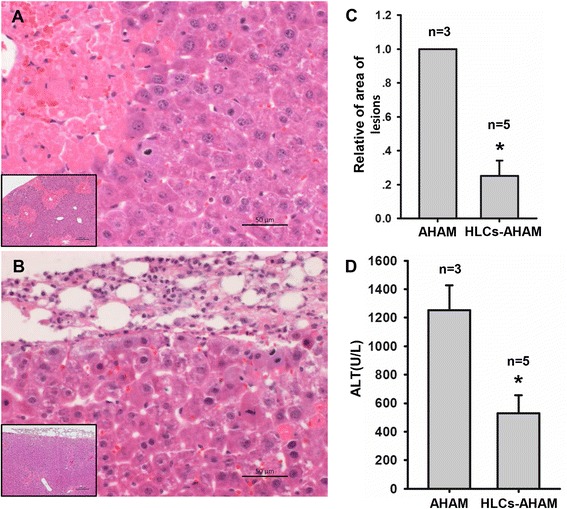
Semiquantitative evaluation of lesions in liver tissue sections following transplantation. H&E staining analysis of the lesions in the liver tissue at 24 hours after the transplantation of AHAM (a) (n = 3) or hASC-HLC–3D-AHAM grafts (b) (n = 5) in a CCl4-induced liver injury immunodeficient mouse model. c Percentage of lesion area was evaluated using Image J software. d Plasma levels of ALT were detected. *Statistically significant compared with the AHAM graft (p <0.05). AHAM acellular human amniotic membrane, ALT alanine amino transferase, HLC hepatocyte-like cell