
Fig. 6.
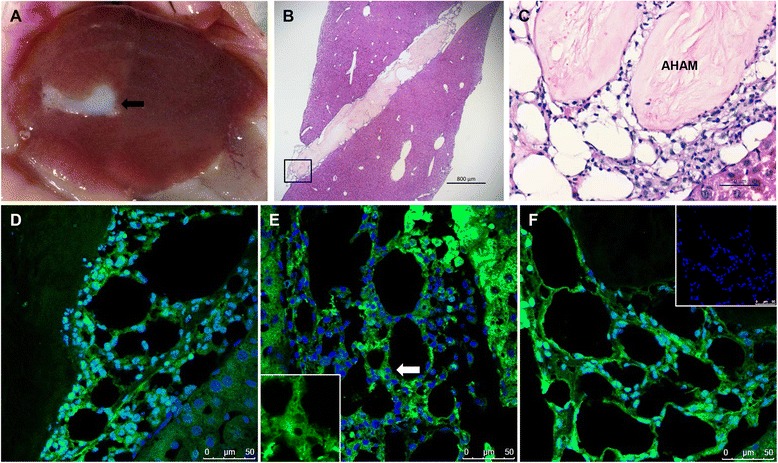
Implantation of the hASC-HLC–3D-AHAM graft into the CCl4-injured liver. a Gross appearance of the hASC-HLC–3D-AHAM graft in the injured liver at 3 days post implantation. Arrow shows the location of the graft. b, c H&E staining analysis of the graft integrated with the liver tissue. Scale bars: 800 μm b, 50 μm c. Immunofluorescence staining of human nuclei (d), ALB (e), and HNF4α (f) in the hASC-HLC–3D-AHAM graft in the CCl4-injured liver. Scale bar: 50 μm. Negative control using isotype IgG for immunofluorescence (f) (insert). AHAM acellular human amniotic membrane