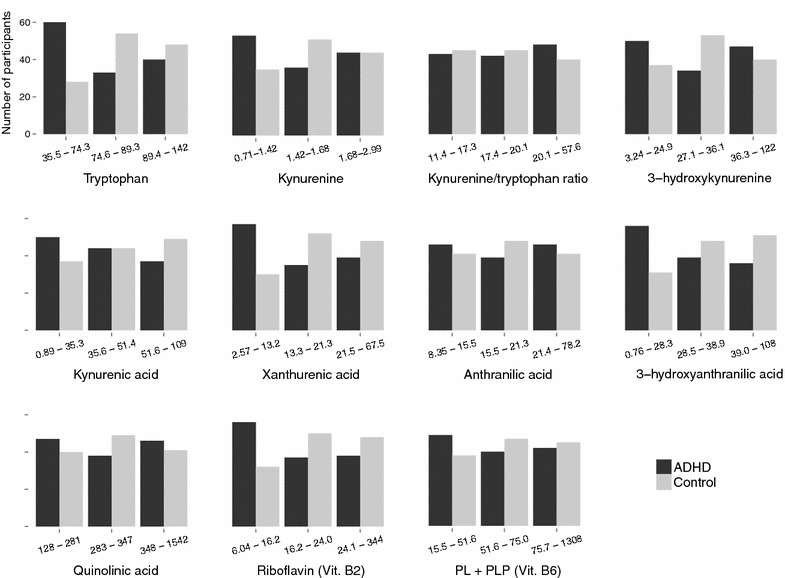
Fig. 2.

Distribution in tertiles of biochemical variables. Each pair of columns contains a third of the participants. All participants are included (N = 264). ADHD patients are strongly represented in the lower concentrations of several metabolites, including tryptophan, XA, HAA and riboflavin. Controls are in majority in the middle concentrations of all metabolites except for KA
